Check out Investor Copilot custom GPT, which lets you enjoy ChatGPT functionality with recent financial information
Conversationally interact with ChatGPT to now analyze updated prices, technical indicators, financial statements, macro-economic/company news & more for Stocks, ETFs & Cryptos
Conversationally interact with ChatGPT to now analyze updated prices, technical indicators, financial statements, macro-economic/company news & more for Stocks, ETFs & Cryptos
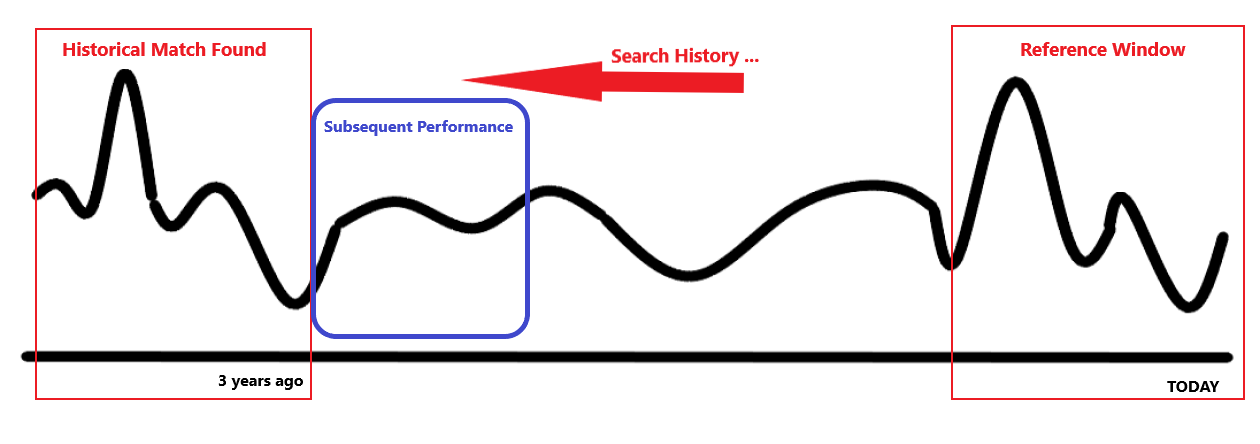
Chart Pattern Matching for [SPY] SPDR S&P 500 ETF
Data updated 2025-Jul-16 (Wednesday)Chart Pattern Matching analyzes performance history for SPDR S&P 500 ETF to find similar patterns using a 5-day sliding window for Daily Performance compared to the prevailing pattern up to last market close on 2025-Jul-16. Pattern Matching is an AI variation of traditional Technical Chart analysis (where humans interpret Chart patterns looking for certain shapes). Subsequent performances summarized below for top matches
Provided As-is for informational/educational purposes only and should not be construed as investment advice . Past performance may not be not indicative of future results. Always consult your Investment Adviser before any decision
Share
Use widget to view Pattern Matching for other Stocks/ETFs/Indices
Select Metric above to Pattern Match against
Select Timeframe above to Pattern Match against
Outlook
Pattern Matching 5-day Daily Performance results for SPDR S&P 500 ETF are calculated as of 2025-Jul-16 (4 months ago):
Next 5-day performance is estimated to be -0.2% using the mean of all subsequent performances (as frequency distribution is near even) of close matches. Outlook is neutral
Next 10-day performance is estimated to be -0.4% using the mean of all subsequent performances (as frequency distribution is near even) of close matches. Outlook is neutral
Next 20-day performance is estimated to be +1.4% using the more frequently occurring up subsequent performances of close matches. Outlook is bullish
Next 50-day performance is estimated to be +5.1% using the more frequently occurring up subsequent performances of close matches. Outlook is bullish
Next 100-day performance is estimated to be +9.2% using the more frequently occurring up subsequent performances of close matches. Outlook is bullish
Next 200-day performance is estimated to be +11.9% using the more frequently occurring up subsequent performances of close matches. Outlook is bullish
Summary 2025-Jul-16 Wednesday
| Next 5d | Next 10d | Next 20d | Next 50d | Next 100d | Next 200d | |
|---|---|---|---|---|---|---|
|
Frequency
|
|
|
|
|
|
|
|
Mean
|
-0.2%
|
-0.4%
|
+0.6%
|
+2.5%
|
+6.0%
|
+4.8%
|
|
Median
|
-0.1%
|
-0.1%
|
+0.4%
|
+4.4%
|
+7.8%
|
+5.9%
|
|
Minimum
|
-2.6%
|
-3.5%
|
-2.3%
|
-4.7%
|
-6.3%
|
-16.3%
|
|
Maximum
|
+3.0%
|
+2.1%
|
+2.8%
|
+7.3%
|
+12.3%
|
+24.8%
|
While traditional Chart Analysis looks for specific shapes (e.g. Double Top / Bottom, Cup & Handle, Head & Shoulders, Wedge etc.) and interprets them as being bullish/bearish, Pattern Matching instead looks at the current pattern (whatever that may be) and goes back in time to find similars. Calculation is based on Procrustes Analysis techniques using absolute values as well as overall shape of pattern. Absolute values are not used for Unbounded metrics (like Price), which are normalized
Closest pattern matches for 2025-Jul-16 below. Longer time-frames inherently have lower match scores. Click on date to view historical record or inspect charts side-by-side on historic date vs last close using the compare functionality
| Date | Match Score | Actions | Next 5d | Next 10d | Next 20d | Next 50d | Next 100d | Next 200d |
|---|---|---|---|---|---|---|---|---|
|
94.5
|
|
+1.3%
|
|
|
|
|
|
|
|
93.0
|
|
+0.4%
|
|
|
|
|
|
|
|
91.7
|
|
+0.9%
|
+0.1%
|
|
|
|
|
|
|
91.5
|
|
+0.3%
|
+0.4%
|
+1.8%
|
+5.9%
|
+7.8%
|
+4.9%
|
|
|
91.1
|
|
-2.5%
|
-1.2%
|
+0.7%
|
+3.7%
|
+6.5%
|
+5.1%
|
|
|
91.0
|
|
+3.0%
|
|
|
|
|
|
|
|
90.8
|
|
-0.2%
|
-0.1%
|
+0.5%
|
+7.3%
|
+11.3%
|
+20.8%
|
|
|
90.4
|
|
-2.5%
|
-1.6%
|
-0.1%
|
+7.2%
|
+11.8%
|
+16.3%
|
|
|
90.2
|
|
+0.4%
|
-1.8%
|
+2.6%
|
+5.8%
|
+7.9%
|
+5.2%
|
|
|
90.1
|
|
+1.7%
|
|
|
|
|
|
|
|
89.9
|
|
-2.3%
|
-3.5%
|
-2.1%
|
-3.6%
|
-5.6%
|
-15.3%
|
|
|
89.7
|
|
-0.1%
|
-0.6%
|
+0.4%
|
+4.3%
|
+6.0%
|
+6.7%
|
|
|
89.5
|
|
-2.6%
|
+0.2%
|
-1.0%
|
-4.5%
|
-6.3%
|
-13.0%
|
|
|
89.1
|
|
+3.0%
|
+2.1%
|
-2.3%
|
-3.5%
|
+12.3%
|
+24.8%
|
|
|
88.8
|
|
-1.0%
|
+0.5%
|
+2.4%
|
+5.3%
|
+9.3%
|
+8.5%
|
|
|
88.8
|
|
-1.2%
|
+0.3%
|
+0.1%
|
+1.8%
|
+7.3%
|
-6.7%
|
|
|
88.6
|
|
-2.6%
|
-0.7%
|
+0.2%
|
-4.7%
|
-5.3%
|
-16.3%
|
|
|
88.4
|
|
-0.4%
|
+0.4%
|
+2.8%
|
+4.7%
|
+8.6%
|
+6.9%
|
|
|
88.2
|
|
-0.2%
|
-0.8%
|
+2.4%
|
+4.6%
|
+12.3%
|
+19.9%
|
|
|
88.0
|
|
+0.3%
|
|
|
|
|
|
Related to SPDR S&P 500 ETF
Information for SPDR S&P 500 ETF
Current Detail : Recent daily/monthly performance & benchmark comparison
Historical Detail : Historical performance & related information using Time Machine
Anomaly Detection : Investigate unusual recent performance & technicals with historical context using AI
Historical Seasonality : Seasonal performance by calendar months
Dividend History : History of Dividend Yield
Technical History : Popular Technical indicator trends (RSI, MACD etc.)
Metric Deciles : Contextualizing recent performance & technical levels into historical decile buckets
Dollar Cost Averaging : Dollar Cost Average (DCA) over time in your portfolio
Moving Averages : Key Simple & Exponential Moving Averages
Historical Analogues : Insights from closest historical matches to recent performance using Artificial Intelligence
Chart Pattern Matching : Insights from similar historical charts to recent chart using Artificial Intelligence Currently Viewing
News Stories : News stories on 2025-Oct-24 on Google
Compare SPDR S&P 500 ETF with other assets
Market Performance : Recent performance across covered assets
Historical Performance : Prior & Subsequent performance across assets on a historical date
Market Technicals : Technical indicator levels across covered assets
Market Seasonality : Seasonal performance by calendar months across covered assets
Pair Correlations : Performance Correlations with other assets
Beta : Volatility relative to the broad market
Performance Comparison : Visually compare/benchmark performance with other assets over time
Side-by-Side Comparison : Contrast with other assets over time in a side-by-side presentation