Check out Investor Copilot custom GPT, which lets you enjoy ChatGPT functionality with recent financial information
Conversationally interact with ChatGPT to now analyze updated prices, technical indicators, financial statements, macro-economic/company news & more for Stocks, ETFs & Cryptos
Conversationally interact with ChatGPT to now analyze updated prices, technical indicators, financial statements, macro-economic/company news & more for Stocks, ETFs & Cryptos
Historical Analogues for [AAPL] Apple Inc.
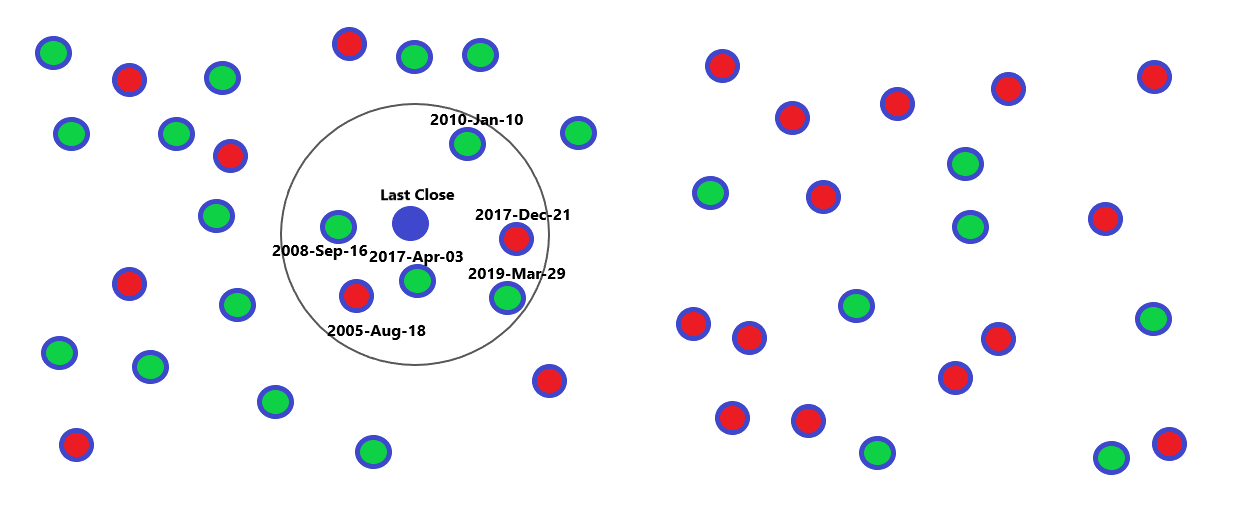
Data updated 2025-Jul-16 (Wednesday)Historical Analogues searches history for Apple Inc. (Example; Use widget to modify) to find similar situations as compared to last market close on 2025-Jul-16 and presents subsequent performances for those cases. This adaptation of popular Machine Learning technique kNN provides historical context to recent performance
Provided As-is for informational/educational purposes only and should not be construed as investment advice . Past performance may not be not indicative of future results. Always consult your Investment Adviser before any decision
Share
Use widget to view Historical Analogues for other Stocks/ETFs/Indices
Outlook
Historical Analogues for Apple Inc. are calculated as of 2025-Jul-16 (5 months ago):
Next 5-day performance is estimated to be +3.8% using the more frequently occurring up subsequent performances of close matches. Outlook is bullish
Next 10-day performance is estimated to be +5.3% using the more frequently occurring up subsequent performances of close matches. Outlook is bullish
Next 20-day performance is estimated to be +8.7% using the more frequently occurring up subsequent performances of close matches. Outlook is bullish
Next 50-day performance is estimated to be +18.4% using the more frequently occurring up subsequent performances of close matches. Outlook is bullish
Next 100-day performance is estimated to be +13.6% using the more frequently occurring up subsequent performances of close matches. Outlook is bullish
Next 200-day performance is estimated to be +18.3% using the more frequently occurring up subsequent performances of close matches. Outlook is bullish
Summary 2025-Jul-16 Wednesday
| Next 5d | Next 10d | Next 20d | Next 50d | Next 100d | Next 200d | |
|---|---|---|---|---|---|---|
|
Frequency
|
|
|
|
|
|
|
|
Mean
|
+1.6%
|
+3.6%
|
+6.3%
|
+16.5%
|
+13.6%
|
+18.3%
|
|
Median
|
+0.8%
|
+5.2%
|
+6.3%
|
+17.6%
|
+15.6%
|
+14.6%
|
|
Minimum
|
-6.7%
|
-4.8%
|
-6.1%
|
-3.2%
|
+1.7%
|
+7.5%
|
|
Maximum
|
+7.2%
|
+6.2%
|
+21.4%
|
+27.1%
|
+17.8%
|
+37.7%
|
Similarity is calculated using normalized euclidean distances and factors curated attributes like the days performance, volatility, prior performance over multiple periods and key technical indicators like RSI, MACD etc.
Historical Analogues is primarily a point-in-time view of the state of the Stock/Index/ETF with lookback anchors past performance rather than comparing the exact path taken to get there. Model does NOT consider historical matches on absolute values of Open/High/Low/Close values. There is inherent subjectivity as there are many different ways to calculate similarity, select features for the model etc. Results are provided for informational purposes only.
Historical Analogues is primarily a point-in-time view of the state of the Stock/Index/ETF with lookback anchors past performance rather than comparing the exact path taken to get there. Model does NOT consider historical matches on absolute values of Open/High/Low/Close values. There is inherent subjectivity as there are many different ways to calculate similarity, select features for the model etc. Results are provided for informational purposes only.
Closest historical matches for 2025-Jul-16 below. Click on date to view historical record or inspect stats side-by-side on historic date vs last close using the compare functionality
| Date | Match Score | Actions | Next 5d | Next 10d | Next 20d | Next 50d | Next 100d | Next 200d |
|---|---|---|---|---|---|---|---|---|
|
97.3
|
|
-0.5%
|
|
|
|
|
|
|
|
96.8
|
|
-6.7%
|
-4.8%
|
-6.1%
|
-3.2%
|
+1.7%
|
|
|
|
96.8
|
|
+2.4%
|
+4.5%
|
+13.5%
|
+17.6%
|
+17.8%
|
+37.7%
|
|
|
96.8
|
|
+6.5%
|
|
|
|
|
|
|
|
96.7
|
|
+7.2%
|
+6.2%
|
+0.7%
|
+14.7%
|
|
|
|
|
96.7
|
|
-0.8%
|
+5.1%
|
+6.7%
|
+21.3%
|
+14.9%
|
+7.7%
|
|
|
96.6
|
|
+0.3%
|
+5.4%
|
+6.3%
|
+27.1%
|
+17.0%
|
+9.2%
|
|
|
96.5
|
|
+5.1%
|
+5.5%
|
+6.6%
|
+24.1%
|
+12.6%
|
+14.8%
|
|
|
96.5
|
|
-2.0%
|
|
|
|
|
|
|
|
96.5
|
|
+6.8%
|
+6.0%
|
+21.4%
|
+8.1%
|
+16.2%
|
+7.5%
|
|
|
96.4
|
|
-0.7%
|
|
|
|
|
|
|
|
96.4
|
|
-2.1%
|
-3.7%
|
-3.3%
|
+12.2%
|
+9.7%
|
+26.2%
|
|
|
96.4
|
|
+5.9%
|
+5.6%
|
+5.0%
|
+25.1%
|
+11.7%
|
+14.6%
|
|
|
96.4
|
|
+0.1%
|
|
|
|
|
|
|
|
96.3
|
|
+1.4%
|
+4.1%
|
+5.9%
|
+18.8%
|
+16.3%
|
+9.7%
|
|
|
96.3
|
|
+2.4%
|
+5.2%
|
+12.7%
|
+15.4%
|
+17.8%
|
+36.9%
|
Related to Apple Inc.
Information for Apple Inc.
Current Detail : Recent daily/monthly performance & benchmark comparison
Historical Detail : Historical performance & related information using Time Machine
Financial Statements : Analyze Income Statement, Balance Sheet & Cashflow Statement and also compare with peers
Bayesian Statement Classifier : Investigate historical financial statements to make probabalistic predictions using Artificial Intelligence
Anomaly Detection : Investigate unusual recent performance & technicals with historical context using AI
Historical Seasonality : Seasonal performance by calendar months
Dividend History : History of Dividend Yield
Technical History : Popular Technical indicator trends (RSI, MACD etc.)
Metric Deciles : Contextualizing recent performance & technical levels into historical decile buckets
Dollar Cost Averaging : Dollar Cost Average (DCA) over time in your portfolio
Moving Averages : Key Simple & Exponential Moving Averages
Historical Analogues : Insights from closest historical matches to recent performance using Artificial Intelligence Currently Viewing
Chart Pattern Matching : Insights from similar historical charts to recent chart using Artificial Intelligence
News Stories : News stories on 2025-Oct-24 on Google
SEC Reports : Quarterly reports around 2025-Oct-24 on SEC Edgar
Compare Apple Inc. with other assets
Market Performance : Recent performance across covered assets
Historical Performance : Prior & Subsequent performance across assets on a historical date
Market Technicals : Technical indicator levels across covered assets
Market Seasonality : Seasonal performance by calendar months across covered assets
Pair Correlations : Performance Correlations with other assets
Beta : Volatility relative to the broad market
Performance Comparison : Visually compare/benchmark performance with other assets over time
Side-by-Side Comparison : Contrast with other assets over time in a side-by-side presentation
Sector : Information Technology sector performance which includes Apple Inc.
Industry : Hardware & Equipment industry performance which includes Apple Inc.