Check out Investor Copilot custom GPT, which lets you enjoy ChatGPT functionality with recent financial information
Conversationally interact with ChatGPT to now analyze updated prices, technical indicators, financial statements, macro-economic/company news & more for Stocks, ETFs & Cryptos
Conversationally interact with ChatGPT to now analyze updated prices, technical indicators, financial statements, macro-economic/company news & more for Stocks, ETFs & Cryptos
[RSG] Republic Services, Inc. - Time Machine
Data updated 2021-Mar-16 (Tuesday)Quick Instructional video for this page. Collapse this after viewing by clicking How-to button above. Open in new tab
Share
Historical Summary: 2021-Mar-16 Tuesday
| Open | $96.58 | High | $97.16 +0.60% |
|---|---|---|---|
| Close | $96.60 | Low | $95.79 -0.82% |
| Volume | 762 Thousand 0.77x | Volatility | 1.43% |
| Change |
+$0.03
+0.03%
|
Streak | ↑ 3 days +1.47% |
| 20d SMA | $92.49 +4.4% | 50d SMA | $92.83 +4.1% | 100d SMA | $94.26 +2.5% | 200d SMA | $91.47 +5.6% |
| RSI | 65 | MACD | 0.65 | ADX | 28.5 | Stochastic Oscillator | 90.7 86.3 |
| CCI | 111.1 | ATR | 1.74 | OBV | 268 Million | Chaikin A/D | 459 Million |
Choose view type
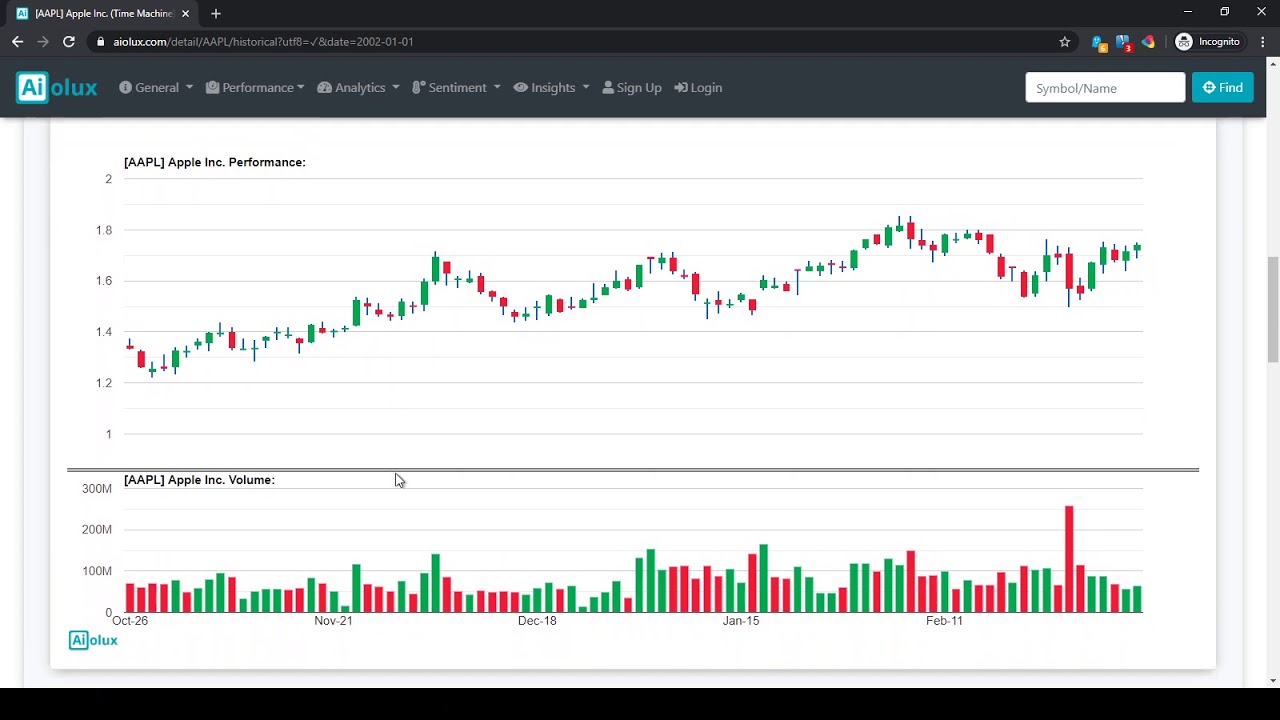
Monthly Performance for Republic Services, Inc.. Click on candlesticks in Chart to show/hide summary for day or navigate to historical record (Time Machine functionality)
Max Chart Timespan
Max Chart Timespan
Note: Performance over Key Timeperiods for Republic Services, Inc. up to close of 2021-Mar-16 at $96.60
Performance Benchmarks from 2021-Mar-16 for Republic Services, Inc.:
Related to Republic Services, Inc.
Information for Republic Services, Inc.
Current Detail : Recent daily/monthly performance & benchmark comparison
Historical Detail : Historical performance & related information using Time Machine Currently Viewing
Financial Statements : Analyze Income Statement, Balance Sheet & Cashflow Statement and also compare with peers
Bayesian Statement Classifier : Investigate historical financial statements to make probabalistic predictions using Artificial Intelligence
Anomaly Detection : Investigate unusual recent performance & technicals with historical context using AI
Historical Seasonality : Seasonal performance by calendar months
Dividend History : History of Dividend Yield
Technical History : Popular Technical indicator trends (RSI, MACD etc.)
Metric Deciles : Contextualizing recent performance & technical levels into historical decile buckets
Dollar Cost Averaging : Dollar Cost Average (DCA) over time in your portfolio
Moving Averages : Key Simple & Exponential Moving Averages
Historical Analogues : Insights from closest historical matches to recent performance using Artificial Intelligence
Chart Pattern Matching : Insights from similar historical charts to recent chart using Artificial Intelligence
News Stories : News stories on 2021-Mar-16 on Google
SEC Reports : Quarterly reports around 2021-Mar-16 on SEC Edgar
Compare Republic Services, Inc. with other assets
Market Performance : Recent performance across covered assets
Historical Performance : Prior & Subsequent performance across assets on a historical date
Market Technicals : Technical indicator levels across covered assets
Market Seasonality : Seasonal performance by calendar months across covered assets
Pair Correlations : Performance Correlations with other assets
Beta : Volatility relative to the broad market
Performance Comparison : Visually compare/benchmark performance with other assets over time
Side-by-Side Comparison : Contrast with other assets over time in a side-by-side presentation
Sector : Industrials sector performance which includes Republic Services, Inc.
Industry : Commercial Services industry performance which includes Republic Services, Inc.