Check out Investor Copilot custom GPT, which lets you enjoy ChatGPT functionality with recent financial information
Conversationally interact with ChatGPT to now analyze updated prices, technical indicators, financial statements, macro-economic/company news & more for Stocks, ETFs & Cryptos
Conversationally interact with ChatGPT to now analyze updated prices, technical indicators, financial statements, macro-economic/company news & more for Stocks, ETFs & Cryptos
Daily S&P 500 Highs [Information Technology]
Data updated 2024-Nov-22 (Friday)Quick Instructional video for this page. Collapse this after viewing by clicking How-to button above. Open in new tab
Share
Choose condition for frequency distribution
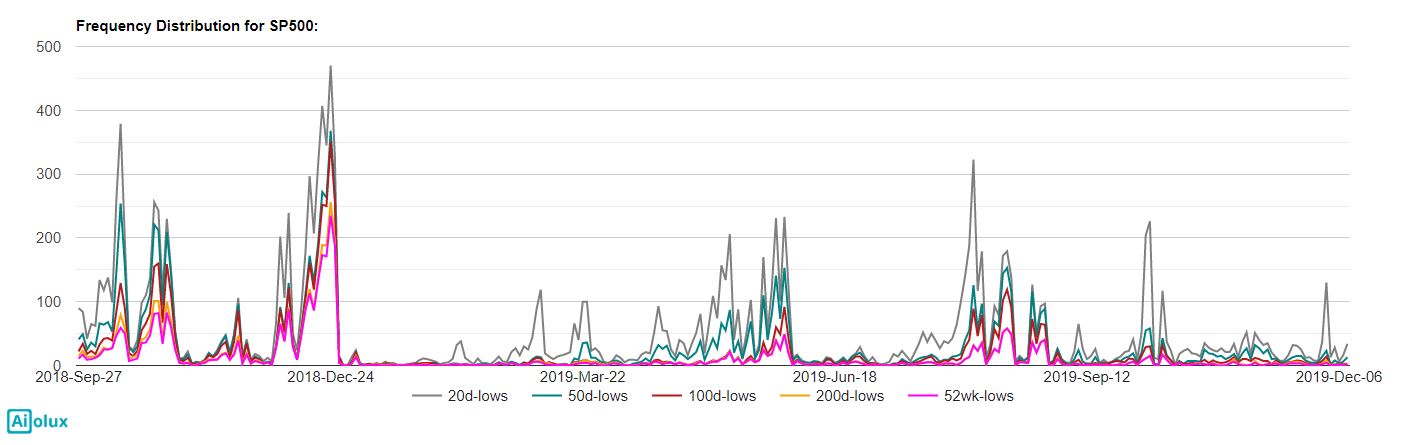
Frequency Distribution of S&P 500 constituents at various period highs updated up to Nov-22 (Friday). Use blue widget below to further filter by Sector
Use widget to select sectors
Calculation Methodology: Daily highs are compared with highs of key prior periods [20-days, 50-days, 100-days, 200-days, 52-weeks]
Only Current S&P500 constituents are considered (even for historical dates)
Only Current S&P500 constituents are considered (even for historical dates)
How to use this:
Elevated numbers of stocks hitting higher period highs/lows (e.g. 200-day, 52-week) lines may signal major tops/bottoms in the medium-term for the broader market or a particular sector
Similarly elevated levels for shorter period highs/lows indicate overbought/oversold conditions in the shorter term
Interpretation above is not comprehensive but rather just a starting point of understanding. Experienced market professionals typically use a combination of different datapoints to drive decisions
Interpretation above is not comprehensive but rather just a starting point of understanding. Experienced market professionals typically use a combination of different datapoints to drive decisions
Highs/Lows Distribution calculated using current S&P 500 constituents shows number of stocks at key period highs. Table displays S&P 500 stocks filtered for Information Technology sector hitting key period highs on 2024-Nov-22
| Symbol | Name | Sector | Max Highs Period |
|---|---|---|---|
| NTAP |
NetApp, Inc.
|
Information Technology | 52wk |
| ADSK |
Autodesk, Inc.
|
Information Technology | 52wk |
| NOW |
ServiceNow Inc
|
Information Technology | 52wk |
| CDNS |
Cadence Design Systems, Inc.
|
Information Technology | 50d |
| KEYS |
Keysight Technologies Inc
|
Information Technology | 52wk |
| BR |
Broadridge Financial Solutions, ...
|
Information Technology | 52wk |
| IBM |
International Business Machines ...
|
Information Technology | 20d |
Related Links for Information Technology
Dashboard : Market Pulse using broad themes (e.g. Growth vs. Value, Equities vs. Treasuries etc.)
Snapshots : Popular lists of stocks & etfs (best streaks, most beaten down etc. in last X days)
Market Performance : Recent performance across covered assets
Historical Performance : Prior & Subsequent performance across assets on a historical date
Market Technicals : Technical indicator levels across covered assets
Market Seasonality : Seasonal performance by calendar months across covered assets
Performance Comparison : Chart compare/benchmark performance with multiple assets over time
Side-by-Side Comparison : Contrast with other assets over time in a side-by-side presentation
Sector : Analyze & compare Sector performance
Industry : Analyze & compare Industries within Sectors
Breakouts & Breakdowns : Identifying stocks/etfs which recently traded up/down in unusually elevated volumes
Swing Volatility : Identifying stocks/etfs with elevated volatility
Advance/Decline : Sentiment using accumulated advances & declines in S&P 500 stocks
Highs/Lows : Sentiment using frequency of key highs/lows in S&P 500 stocks Currently Viewing
Moving Average : Sentiment using frequency of S&P 500 stocks above key moving averages
Technical Distribution : Sentiment using frequency distribution of S&P 500 stocks with bullish/bearish technical levels